
Dyno Log
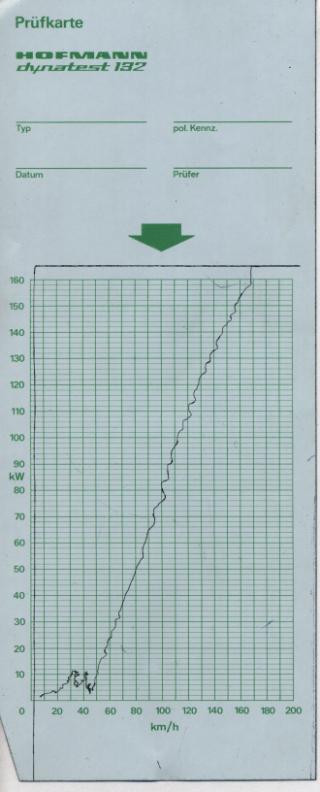
Car: MY 1999 Saab 9-3 Viggen Convertible, 225 hp base- My very first dyno run - to strong for the dyno
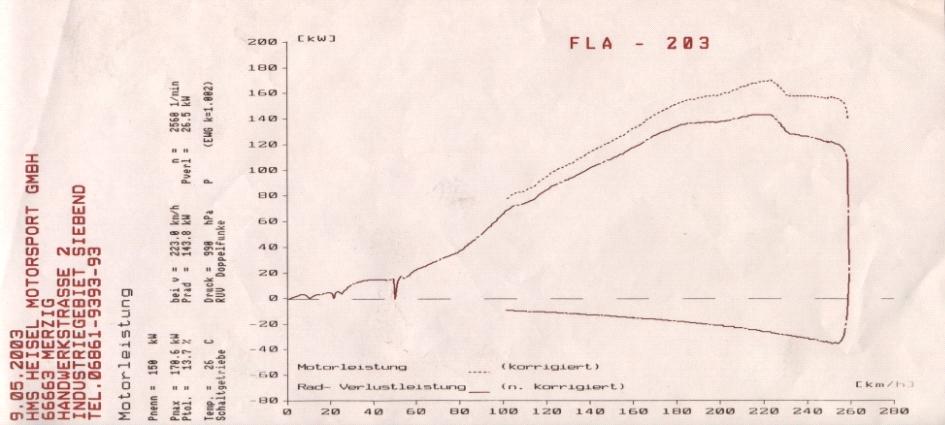
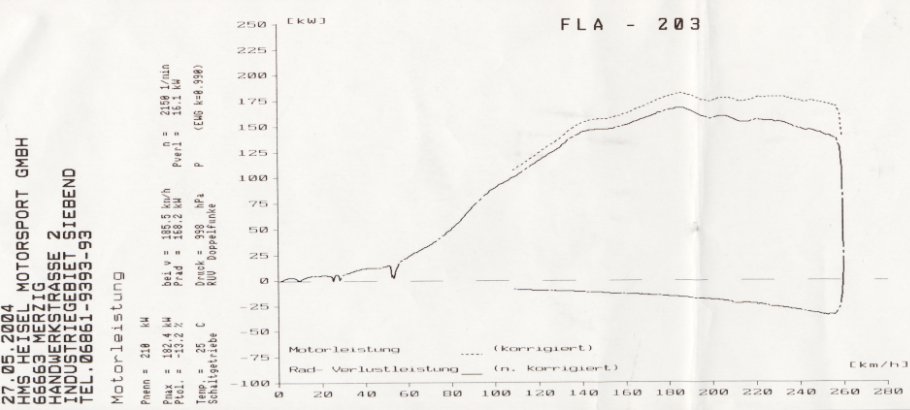
- 05/09/03 Heisel Motorsport - Saab Stock Software - 232 hp
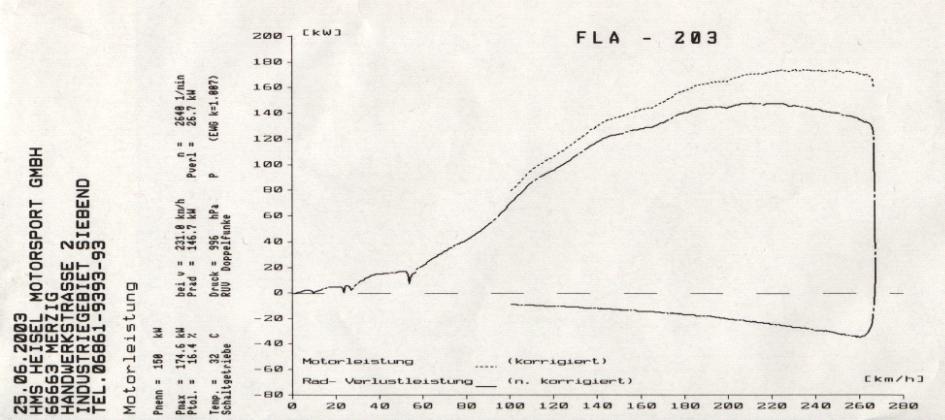
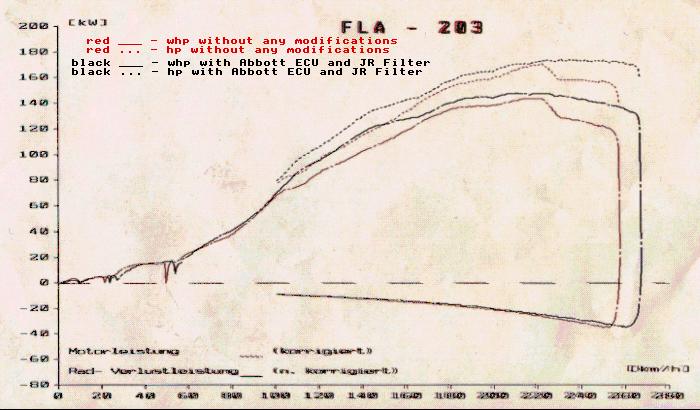
- 06/25/03 Heisel Motorsport - Abbott Stage 1 software - 237 hp
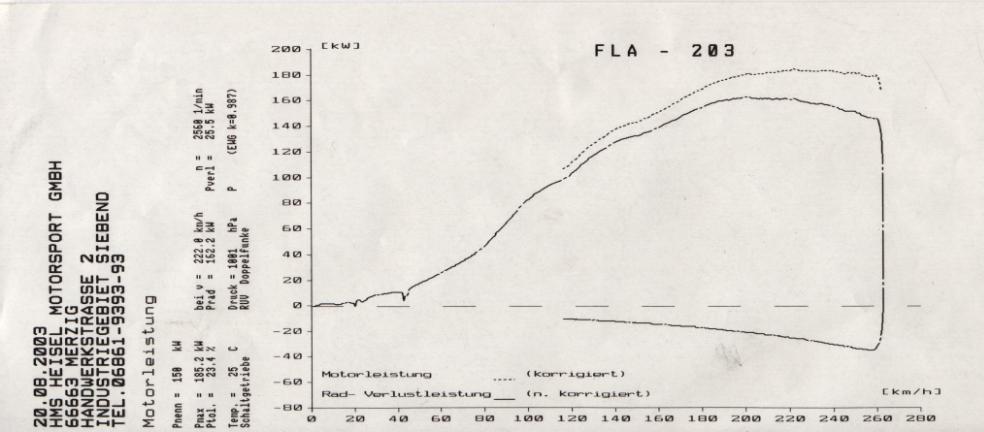
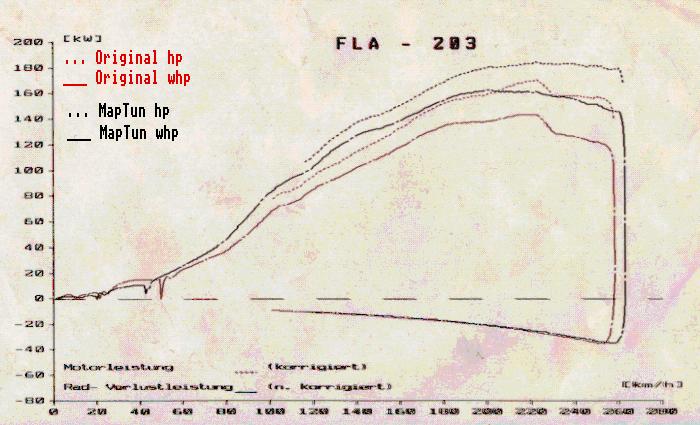
- 08/20/03 Heisel Motorsport - MapTun Stage III software - 252 hp
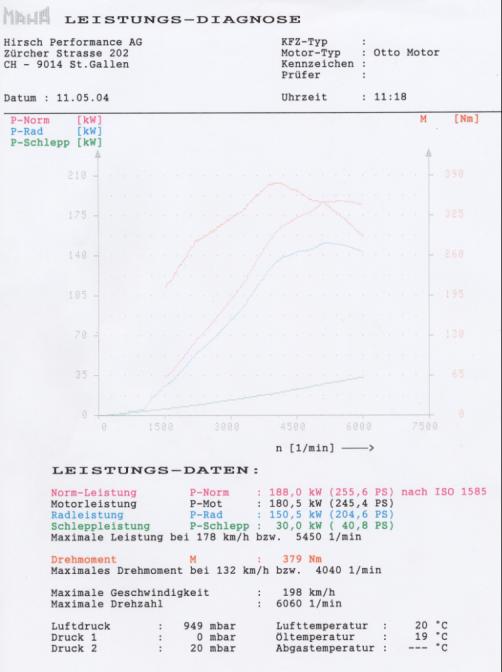
- 05/11/04 Hirsch Performance - Saab stock software - 245 (251*) (255**) hp
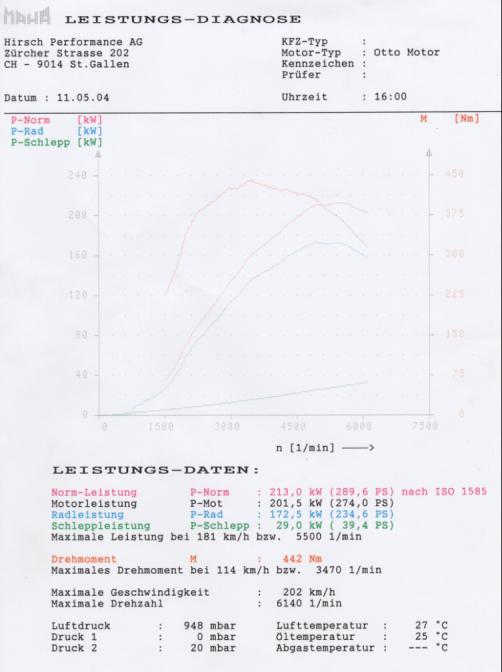
- 05/11/04 Hirsch Performance - Hirsch custom Software - 274 (280*) (290**) hp
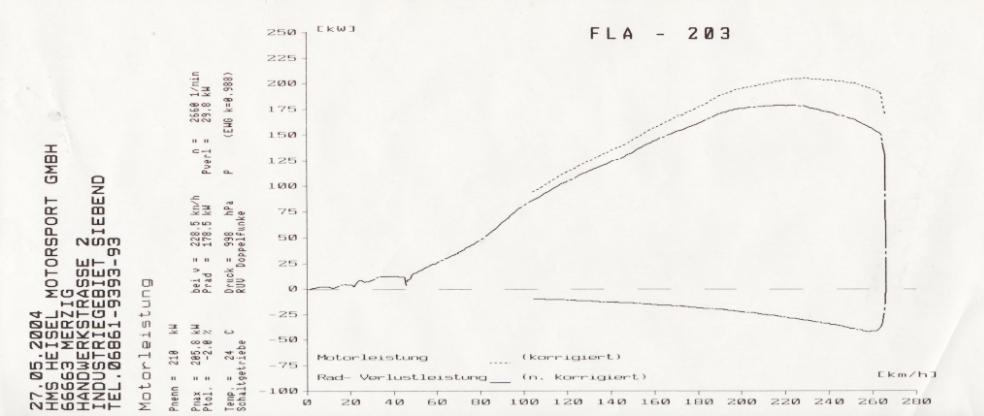
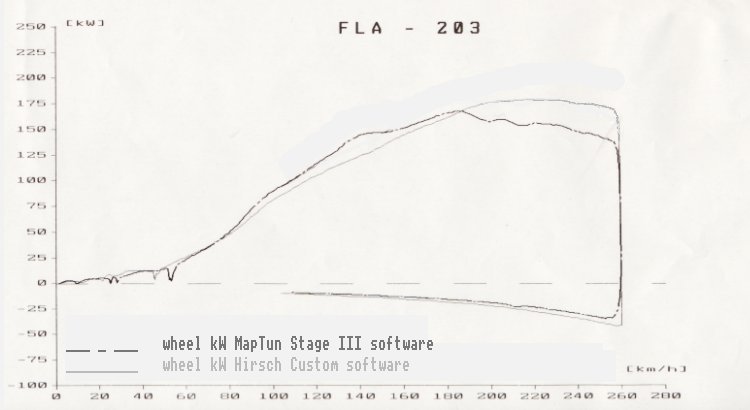
- 05/27/04 Heisel Motorsport - MapTun Stage III Software - 269*** hp
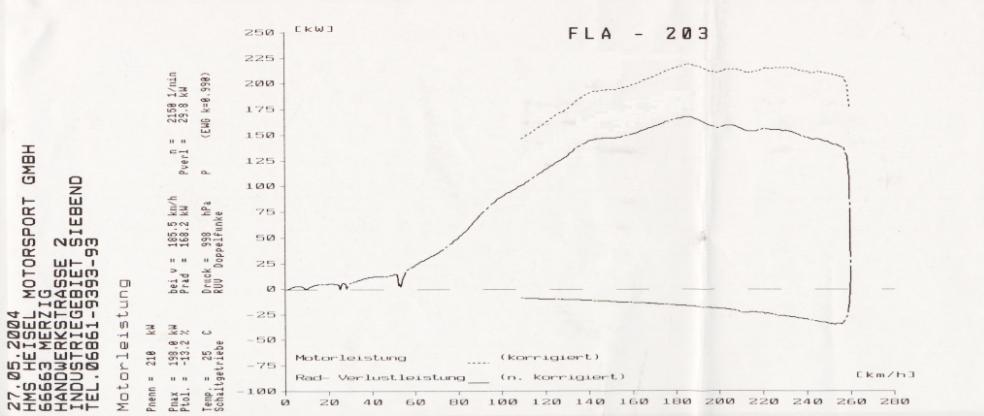
- 05/27/04 Heisel Motorsport - Hirsch custom Software - 280 hp
Hardware Changes: High Flow Air Filter, 3" Downpipe, Race Cat, 3" Cat back system
Hardware Changes: MY 2004 base engine, Race Intercooler, Gas Flowed Head
Hardware changes: intake pipe to turbo from MY 2000 and later Viggen (= conversion to 230 hp base)
* the Hirsch Dyno facility is at an altitude of approx. 2000 Feet. Compared to the Heisel Dyno, it showed to read 6 hp lower.
** the Hirsch graphs also show "Norm-hp" corrected to sea level and ideal air-temperature and pressure conditions according to ISO 1585
*** because transmission loss was measured incorrectly on this dyno run, this graph was corrected by hand. The original graph can be found here
Some information on the Heisel Motorsport dynamometer: This facility is also used by the German Mercedes-Benz Tuner Carlsson. Carlsson has their own engine test-bed, and the data used for correction by Heisel are more than 99% correct compared to the test bed. The results from the Heisel dyno can therefore be regarded as the most accurate approach of determining engine power without explanting the engine and testing it on a test bed. Measurements are taken in fifth gear to get a longer, more expressive graph.
Analysis
Using the Abbott software, there is a little more power all the way, especially above 5000 rpm (220 kph). But peak hp is just up by 5 hp - far from the promised 40 hp gain.
With the MapTun Stage III kit, there is much more power all the way, but from 4000 rpm on, where it should keep going up to reach the promised 285 hp at 5000-5500 rpm, it levels and then goes down slowly. The biggest gain achieved by this kit was 38 hp at 3100 rpm. Peak hp was only up by 20 hp, instead of the promised 60 hp.
When I told Hirsch about the hardware modifications I had done to my car, they told me I would not get more than 280 hp "stable" out of the car because of injector and turbocharger restrictions. The Dyno session at Heisel showed that Hirsch reached exactly the claimed figure. Compared the same day and using the same hardware setup, the MapTun software is stronger until the 4000 rpm point (biggest difference, again at 3100 rpm, 26 hp), where power starts going down again, while the Hirsch software pushes on steadily until reaching max power at 4500 rpm and keeping it up until the red line. (The corrected graphs were removed by hand because of incorrectly measured transmission loss on the best MapTun run).